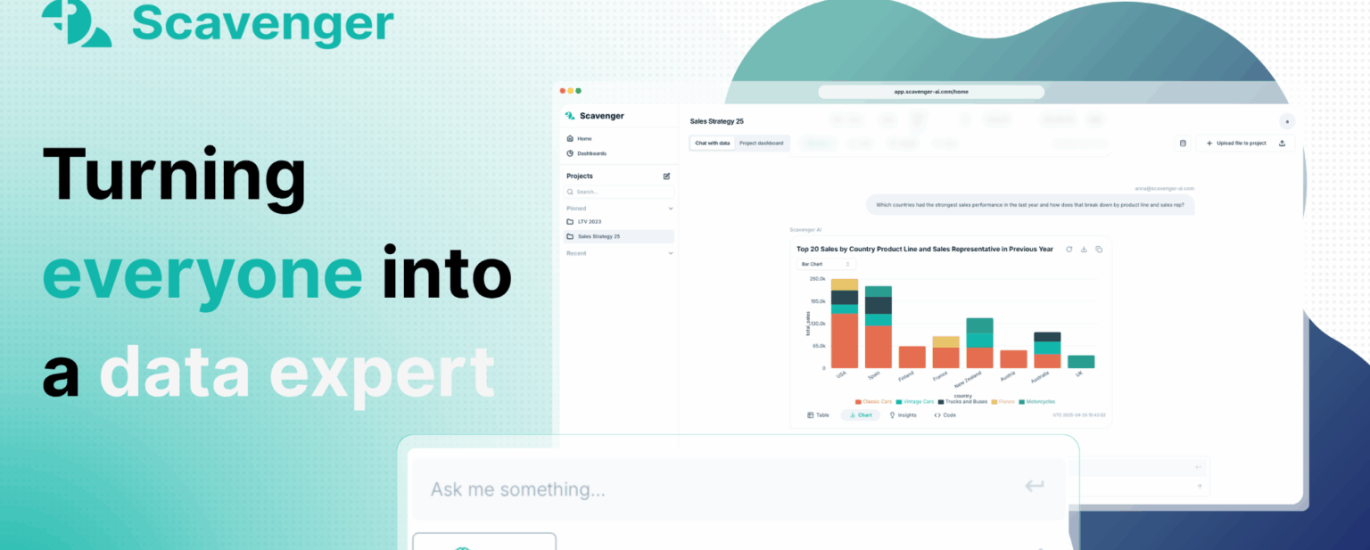
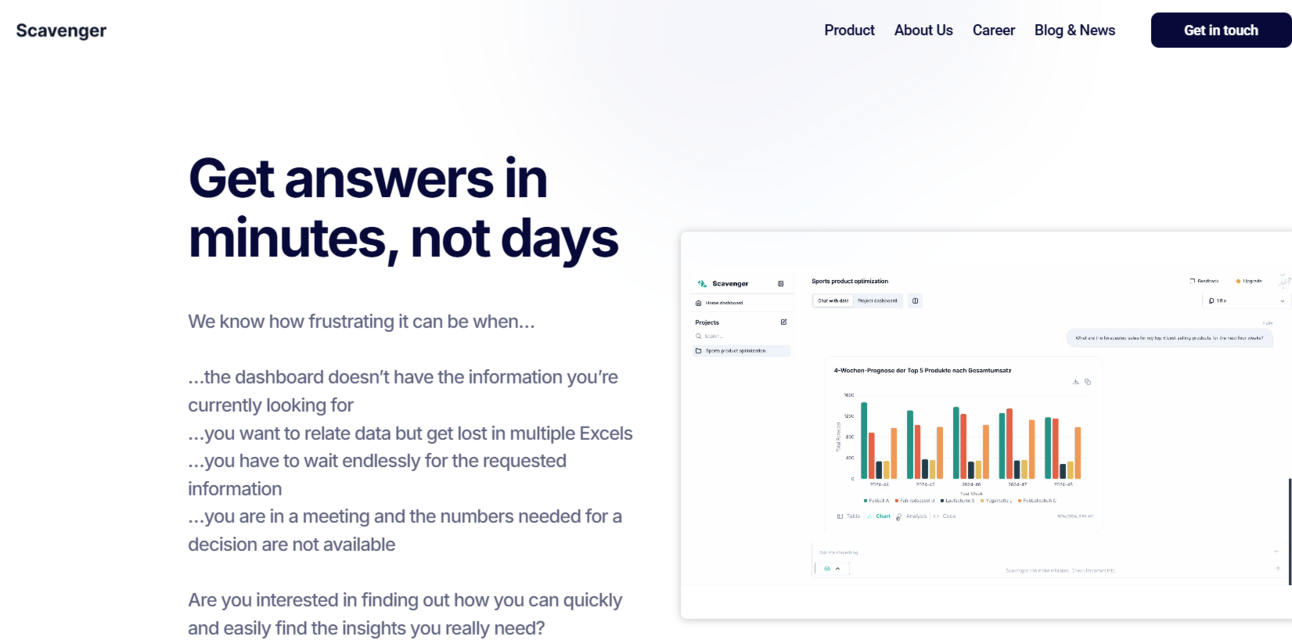
Imagine: you want to know your revenue trends, supply chain bottlenecks, or which customers ghosted you last quarter, without wrestling SQL or waiting for your BI elves. Scavenger lets you chat with your databases in plain English, spinning out visuals, stats, and recommendations in seconds. Think of it as a data whisperer—no programming, no pain—ready ASAP. That’s its groove. And if you need any custom analysis, their development team can custom-create the solution! |
The company is in its early startup phase and just beginning to establish itself. Based in Germany, it’s understandable that some parts of the website and app automatically open in the German language. |
Here is how you can start using it! |
|
Everyday work meets boardroom finesse |
1. Sales reps and controllers
Ask: “Who’s lagging in Germany this month and why?” Boom—chart, insight, next steps. No more ticket to analytics prison. |
2. Supply chain managers
Hunt inflating stock levels, flagged bottlenecks. The AI spots “overstock in warehouse A” before CFO sees it—and saves you euros . |
3. Product teams
Upload Jira exports or app metrics and probe: “What features boost engagement most?” Scavenger dives into anomalies and returns clear wins. |
4. SMEs and non-technical staff
Branch managers, marketers—no coding. Ask “Sales in Spain vs. France, trend over time?” You get a full slide-ready snapshot. |
5. Executive dashboards
Pop the CEO question: “Which regions grew >10% this Q, what’s driving it?” Scavenger gives crisp stats, visuals, and even a plan-of-action. |
|
Business use-cases—big hands, big impact |
Revenue booster: Identify product-channel combinations that drive highest margin . Inventory crunch prevention: Track overstock, optimize reorder cycles, slash costs . Cross‑sell strategy: Find products frequently bought together—hey upsell! Cost center transparency: Fire off “Sum of freight costs per vendor this FY” for instant audit-ready reports.
|
|
How to set up Scavenger in 5 jazzy steps |
Step 1: Demo time
Head to the public demo (launched June 25, 2025) startupreporter.eu. Try sample datasets and vibe-check whether Scavenger speaks your language. |
Step 2: Connect data sources
Choose between uploading Excel/PDF files or connecting live ERP, CRM or SQL sources. Herb the raw data — Scavenger’s “input agent” auto-documents everything. |
Step 3: Ask your first question
Use natural language: e.g., “Give me sales by region this year.” The “analysis agent” runs SQL/Python under the hood, churns insights. |
Step 4: Interpret, visualize, decide
Results arrive as charts, stats, and a plain‑English playbook from the “interpretation agent”. Export dashboards or embed charts directly in PowerPoint. |
Step 5: Iterate like a boss
Update queries, add new datasets, iterate. Every question tunes the AI to your business—soon it’s practically a digital clone advising on everything. |
|
Why it hits differently |
Clear: No jargon, no fuss—just real insights. Democratized: From intern to exec, everyone has data power. Speedy: Seconds, not weeks. Secure & GDPR‑nice: EU‑hosted, GDPR‑compliant servers and transparency baked in Scavenger.
|
|
🎯 Wrap-up |
Feeling like your data’s a chaotic improv session? Scavenger turns it into a chart‑topping hit—easy, fast, actionable. Whether you’re running a one‑person hustle or steering a mid‑size empire, this AI-powered scavenge hunts insights so you can play conductor of your business symphony. |